CAPE Crusade Discredited

The Nobel Prize is arguably the world’s most prestigious award. Several factors contribute to the prize’s extraordinary brand value, including its history, longevity, symbolism, track record, and core values. For further evidence of the Nobel’s prestige value, check the obituary of any winner; the first sentence invariably references the deceased as a Nobel Prize winner.
Linking a point of view to the unassailable authority of a Nobel laureate is a powerful and effective method of persuasion. Such has been the case for pundits arguing that the stock market is grossly overvalued based on the cyclically adjusted price-to-earnings ratio. This valuation measure, known as the CAPE ratio, was co-created by Harvard economist John Campbell and Nobel laureate and Yale economist Robert Shiller in the 1990s.
Shiller’s credibility has been further enhanced by his prediction of two financial bubbles. In Irrational Exuberance, published in 2000, he warned that stocks were in a speculative frenzy just as stocks began to crater in the dot-com crash. In the 2005 edition of his book, Shiller warned that housing was in a bubble. That’s an impressive track record.
The CAPE is defined as price divided by the average of 10 years of earnings (moving average), adjusted for inflation. The purpose of using a 10-year period is to smooth out extremes in the earnings cycle.
The CAPE now stands at 27, which is dead in line with its 25-year average of just under 26, but about 60% higher than its 50-year average of 17. However, according to data compiled by Shiller, the only two times that the ratio has been higher than the current level were in 2000 and 1929 (another year of infamy for the stock market).
In an intriguing Financial Analysts Journal article published earlier this year, Wharton professor Jeremy Siegel pointed out that between 1981 and 2015, the CAPE ratio signaled that equities were overvalued in 416 of 422 months—99% of the time.
Based on research using generally accepted accounting principles, or GAAP, to measure earnings, Siegel argues that accounting rule changes have pushed recent earnings lower, which has caused the CAPE to appear artificially high.
Here are two examples from Siegel’s research where GAAP earnings were lowered, even though there were no changes to the underlying businesses:
- In 1993, banks were required to increase the percentage of their assets that were subject to mark-to-market accounting.
- In 2001, the rules on valuing goodwill changed.
The Wall Street Journal recently constructed an alternative measure of the CAPE using the same methodology as Shiller but with these data substitutions for earnings and prices:
- S&P 500 GAAP earnings were replaced with the Commerce Department’s quarterly data on total U.S. after-tax corporate profits.
- S&P 500 prices were replaced with Federal Reserve data on the total value of U.S. stocks.
The critical distinction is that, unlike the shifting standards of GAAP, the Commerce Department figures rely on corporate tax and financial data that have been consistent over decades.
Using this alternative methodology, stocks look a lot cheaper than with the unadjusted Shiller data. According to the Journal’s analysis:
As of the end of the second quarter, according to the latest data available, the corporate profits CAPE was at about 19—just above its 50-year average of around 17. By contrast, it was 39 at its peak during the tech bubble and 24 at the market’s peak in 2007.
From the 1960s through 2008, the two CAPE measures moved nearly in lockstep with one another. It’s only after 2008 that the divergence begins. Why?
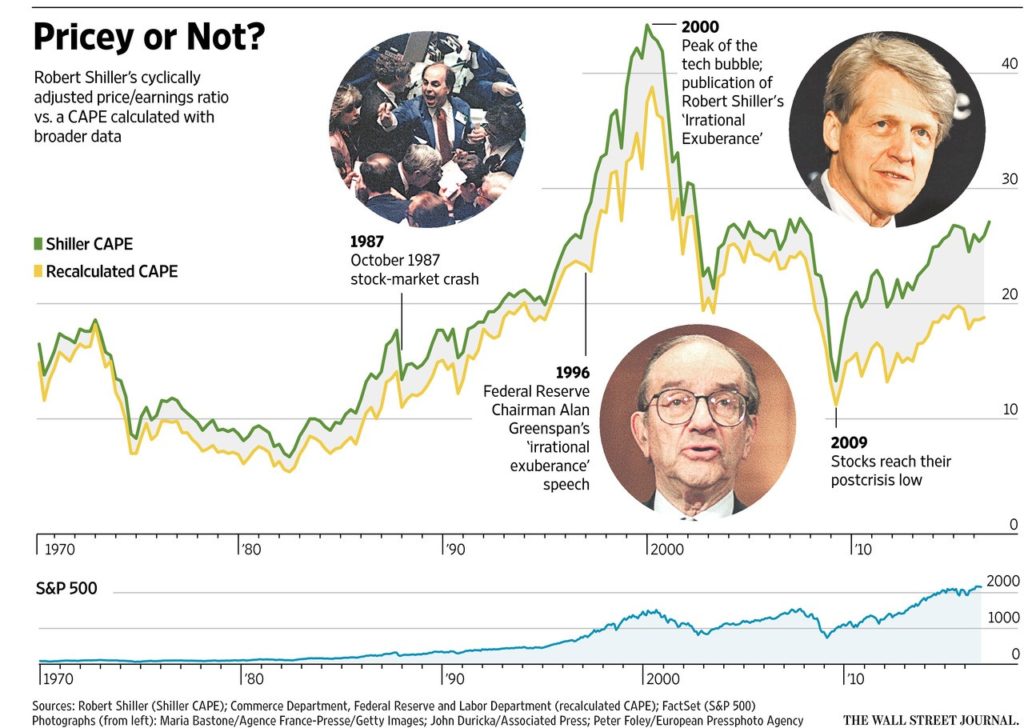
Under GAAP rules, banks and other businesses had huge asset write-downs that slashed earnings. By contrast, under the Commerce Department’s measure, the asset write-downs and loan loss provisions were treated as reductions of corporate assets rather than hits to earnings. The result is an enormous disparity in earnings, with the corporate profits measure much higher than the GAAP measure. This disparity is still being captured in the denominator as we move through the 10-year period following the financial crisis.
Professor Siegel’s argument is that the lower GAAP earnings have artificially pushed the CAPE ratio higher.
Why does this arcane accounting discussion even matter? It matters because Wall Street research departments and market pundits alike are using CAPE as a market timing tool and as the basis for their strident rants that the stock market is overvalued.
So how well does CAPE work as a market timing tool? As it turns out, not well at all.
New York University finance professor Aswath Damodaran created a model that dynamically allocated money between stocks and Treasurys based on the relative value of the CAPE, increasing the allocation to stocks when the CAPE was low and vice versa. He tested different valuation thresholds and target allocations, but the conclusion was always the same.
Over the past 50 years, Professor Damodaran couldn’t find a single way to use CAPE as a market timing tool to beat a simple buy-and-hold strategy, nor does he believe that CAPE represents an improvement over a conventional price-earnings ratio as a method to value stocks. “This is one of the most oversold, overhyped metrics I’ve ever seen,” says Mr. Damodaran.
And what says Professor Shiller? According to a recent article in the Journal:
Mr. Shiller agrees that the CAPE can’t be used as a market-timing tool, per se. Rather, he thinks that investors should tilt their portfolios away from individual stocks that have high CAPEs. But he says he isn’t ready to modify his CAPE for judging the overall market.
In a related article (“Equities Are Not Overvalued”), we warned of the dangers of a one-variable analysis (P/E ratios) in a two-factor equation that must include interest rates. Other things being equal, higher interest rates mean lower valuations, and lower rates mean higher valuations.
We have no quarrel with Professor Shiller. He is a Nobel laureate, after all.
Instead, our issue is with the hysteria surrounding the CAPE crusade, which we now believe has been fully discredited as a market timing tool. Remember, the CAPE ratio signaled that equities were overvalued in an astounding 416 of 422 months between 1981 (S&P 500 price of 133) and 2015 (S&P price of 2,044). Holy overvalued ratio, Batman! That would have been a long—and costly—time to be out of the stock market.
Behavioral Takeaway
Confirmation bias is our tendency to search for, interpret, focus on and remember information in a way that confirms our preconceptions. For example, you might conclude that since the stock market is at record high level, it must be overvalued.
This is a type of cognitive bias; it’s also a systematic error of “inductive” reasoning. While the conclusion of a deductive argument is certain, the truth of the conclusion of an inductive argument is probable, based on the evidence. And people tend to interpret ambiguous evidence as supporting their existing position.
Before reaching any important conclusion, it is critical to consider all the facts, data and evidence. It’s also essential to consider the sources providing the information and any potential biases those sources may have.