Living on Dividends

Since 2001, the average dividend yield of the S&P 500 index has been slightly below 2%. Though it’s rarely described this way in the financial media, the full-year 2018 S&P 500 dividend was $53.86. Relative to a Dec. 31, 2018 closing S&P price of about 2,507, the dividend yield for 2018 was 2.1%.
The power of dividend growth is perhaps the most easily understood yet most underappreciated feature of equity investing, and it has profound implications for people who are considering their asset allocation for retirement. Let’s start with the basics.
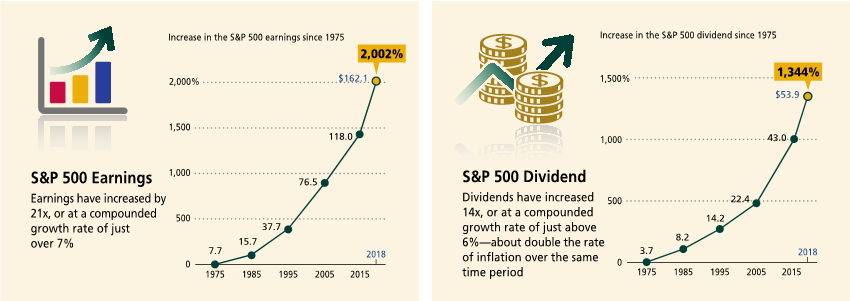
Since 1975, when the S&P 500 dividend was about $3.70, dividends have increased over 14x, or at a compounded growth rate of 6.4%. This is about double the rate of inflation over the same time period.
How and why have dividends compounded at this rate? Since 1975, the earnings of S&P companies have increased by 21x, or at a compounded growth rate of about 7.3%. Assuming that companies maintain a steady payout ratio of cash dividends relative to their earnings, it follows that the dividend growth rate should reflect the earnings growth rate. The charts below illustrate how earnings and dividends have largely followed the same trajectory for the last four decades.
S&P 500 Earnings and Dividends
Changing Nature of Cash Return to Shareholders
Over time, however, dividend yields have declined as companies return cash to shareholders in the form of both cash dividends and stock buybacks.
According to research by New York University Professor Aswath Damodaran, since 2001 S&P 500 companies have paid out about 85% of their net income as cash, consisting of (i) average dividends payouts of 35.5% plus (ii) average buyback payouts of 49.0%.
From a stockholder’s perspective, the average dividend yield as a percentage of market capitalization has been 1.9% and the average buyback yield has been 2.8%, resulting in a total effective “cash yield” of 4.7%. For the past nine years, the buyback yield has been higher than the dividend yield.
The chart from J.P. Morgan below captures the changing sources of equities’ total return over the last seven decades. Of the 10.9% S&P 500 total average annualized return since 1950, 7.5% is attributable to capital appreciation and 3.4% is attributable to dividends. For the 13.1% average annualized return from 2010 to 2018, capital appreciation accounted for 10.7% while dividends were responsible for only 2.4%.
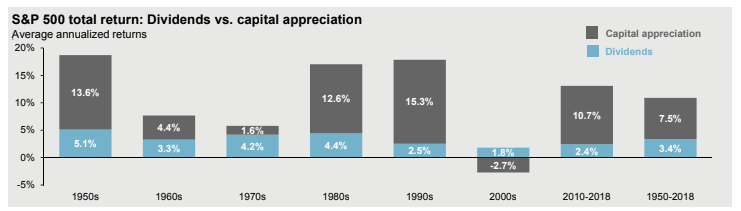
Source: J.P. Morgan “Guide to the Markets”
In short, primarily for reasons of tax efficiency to their shareholders, American companies are now returning more cash to investors in the form of buybacks than in dividends.
Income Yield on Original Investment
When the S&P 500 SPDR ETF (SPY) was first introduced in 1993, the fund paid a total of $1.10 in dividends per share, for a dividend yield of 3.8%. By the end of 2018, SPY paid a total of $5.10 in dividends per share, representing total growth of 360%, or compounded growth of 6.1% per year. So even though the dividend yield had declined to just over 2%, the $5.10 in 2018 dividends represented a yield on original investment of nearly 18%.
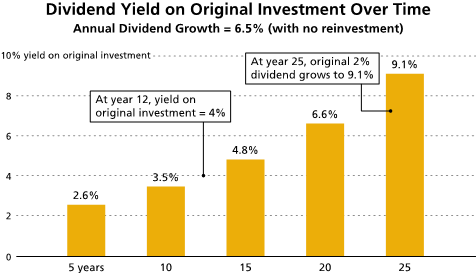
If you own a $1 million stock portfolio yielding 2% and used the dividends for living expenses, in the first year your dividend income would be $20,000. Assuming dividends grew by 6.5% annually and with no reinvestment, by year 12 your annual dividend income would be just about $40,000, and by year 25 almost $91,000 (for a yield on original investment of 9.1%).
Dividends as a Growing Source of Income
Most people think about risk and safety in terms of principal—the risk that you’ll lose your money and the search for assurance that you won’t. That’s second nature to us, and it’s probably what’s uppermost in our minds when we think about retirement investing.
However, retirees have to pay as much attention to the risk of outliving their money as they do to the risk of losing it. In other words, we have to define risk not just in terms of principal but in terms of purchasing power. And when it comes to building purchasing power, one asset class vanquishes all others: equities.
Moreover, a common misperception is that there are only two basic investment objectives: growth and income. But in modern three-decade retirements, where the maintenance of purchasing power becomes a fundamental objective, there’s a third, very critical, investment objective: growth of income.
Financial Planning Implications
Fixed-income investments—bonds—are just that. They pay a fixed interest rate, while stock dividends grow over time.
Since 1975, the S&P 500 price has increased 28x, or at a compounded growth rate of 8%, excluding dividends. Meanwhile, the value of a bond portfolio remains constant in nominal terms. So while the principal value of a stock portfolio is growing over time, the principal value of a bond portfolio is not.
Purely from a purchasing power perspective, it is a better choice to forego the “safety” of clipping bond coupons and instead let the magic of growing dividends provide growth in income over time.
Behavioral Takeaway
Familiarity bias occurs when an investor has a preference for a well-established paradigm, such as stocks for growth and bonds for income. This can lead to a suboptimal portfolio and a loss of purchasing power over time.