Dividends: Growth in Income

Dividends tend to get short shrift these days. They are almost an afterthought to the capital appreciation potential of common stocks. And unfairly so, since, as of recently, the dividend yield of the S&P 500 exceeds the 10-year Treasury yield by nearly 50 basis points. (See recent related blog: “Exercise the Free Dividend Option”.)
Now that the fourth quarter earnings season is officially over, it’s a good time to take a deeper dive to explore the growth story that is dividends and the relevance to investors.
First, the facts (unless otherwise noted, all data are for the S&P 500 Index as of the end of Q4 2015)[1]:
- Of the 500 companies in the S&P 500 Index, there are 425 that pay dividends (or 85% of the Index constituents).
- Total trailing 12 months (“TTM”) dividend payments were $415 billion—which was the largest payout in at least 10 years, and nearly 50% higher than the 10-year TTM average of $282 billion.
- The TTM dividend per share (“DPS”) was $43.30. This was the largest aggregate DPS in at least 10 years.
- The TTM payout ratio (dividends divided by earnings) reached 38% in Q4, which was the largest ratio since Q3 2009 (when it was nearly 50%). Reason: dividends are rising and aggregate earnings are slumping.
- The S&P 500 TTM dividend yield in Q4 was 2.2%.
[1] All dividend data sourced from FactSet’s “Dividend Quarterly” (March 16, 2016).
- Over recent years, the trend has been increasing DPS but at decreasing growth rates.
- This trend continued in Q4, with a year-over-year TTM DPS growth rate of 9.5%—which marked the first single digit growth rate since Q4 2011 (when YoY growth was only 5.7%). Average YoY growth rate for the past 10 years: 8.4%.
The chart from FactSet below provides a 10-year perspective on both the dividends being paid as well as the number of S&P 500 companies paying them.

Key Takeaways
Income statements took a hit during the Great Recession. Companies shored up their balance sheets by preserving cash and cutting back on dividend payments. Since a bottoming in 2010, dividend payments (on a TTM basis) have nearly doubled, and are now nearly 50% higher than the 10-year average.
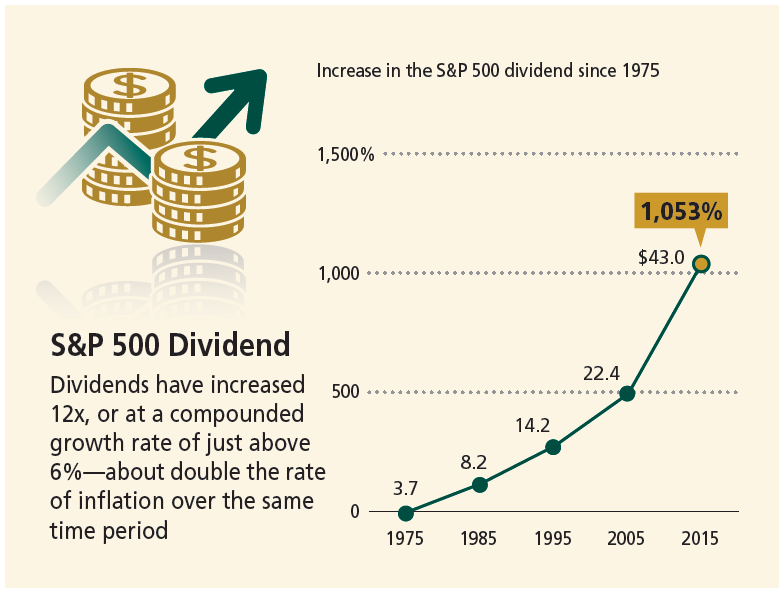
Historical Perspective
As the chart below illustrates, the S&P 500 dividend has grown from about $3.73 per share in 1975 to the most recent TTM level of $43.30—a 12x increase, or just over 1,050%. More importantly, dividends have increased at a compounded growth rate of about 6%, or about double the rate of inflation over the same period. And therein lies the real beauty of dividends: Unlike Treasurys, which provide income only (and most of which, at current yields, is now wiped out by inflation), common stocks have historically generated income and growth in that income, resulting in the preservation and growth of purchasing power over time.
Source: Standard & Poor’s.