Understanding Myopic Loss Aversion

We all know a little bit about probability theory: If you a flip a coin, there is one chance out of two—a 50% probability—that it will come up heads.
Given this knowledge, would you take the following bet? If the coin lands on heads, I’ll pay you $200. But if it lands on tails, you pay me $100.
Under classical economic theory, you should accept the wager, because you have an even chance of either making $200 or losing (only) $100. In theory, since you would you win $200 for each head and lose $100 for each tail, you should come out ahead by $100 for each two times that you flip the coin. With a net benefit of $100 for each two flips, it could also be said that you have a net benefit of $50 for each single flip.
Economists have a more formulaic way of explaining it. They say that the “expected economic outcome” of any single coin flip under these terms is $50, which is calculated by comparing the gain from a win ($200 x 50% probability = $100) less the cost of a loss ($100 x 50% = $50).
However, psychological theory predicts that very few individuals would accept such a wager, because people tend to be “loss-averse.” Psychological research and behavioral evidence has demonstrated that humans typically regret losses at least twice as much as they appreciate similar-sized gains.
But what if instead of a single flip, we agreed to base the wager on the net result after flipping the coin 1 million times? Would you take the bet then? I should hope so. You would make an easy $50 million! (That’s based on the expected economic outcome of $50 per flip.)
Application to the Stock Market
Investors approach investing in the stock market with the same cognitive bias toward loss aversion.
Historically, the stock market, calculated on the basis of price only and excluding dividends, has been up in roughly two years out of three. So there is about a 67% chance that in any given year, the stock market will be higher on December 31 than it was on January 1.
On a daily basis, since 1926 the S&P 500 has had positive returns only 53% of the time. It’s pretty close to 50/50, which is why returns appear random to someone watching a ticker tape in real time.
On the other extreme, in the post war era there has never been a 20-year rolling period that has experienced losses, so the chance of a positive return has been 100%. The volatile and asymmetric returns experienced over days and weeks are smoother over the course of months and years. While this is no guarantee of future returns, it demonstrates the importance of specifying the right time horizon to minimize portfolio risk.
The next step is to figure out the perceived economic benefit of investing in the stock market, given that investors are loss-averse and regret losses twice as much as they appreciate similar-sized gains.
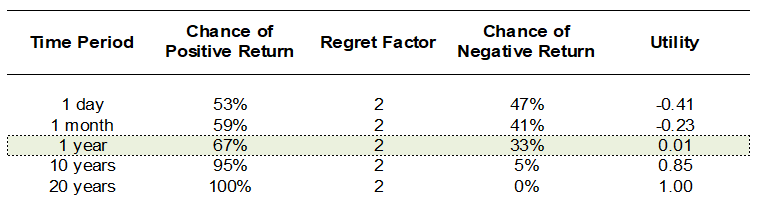
For a one-day evaluation period, we would calculate the perceived economic benefit, also known as “adjusted utility” as follows:
53% (chance of positive return) – [2 (the regret factor) x 47% (the chance of a negative return)] = -.41.
In this framework, utility can have any value between –1.0 and 1.0, with higher values corresponding to greater perceived economic benefit and lower values corresponding to higher perceived economic risk.
At one month, the probability of a positive return rises to 59%, but the utility is still negative (–0.23). In fact, it’s not until one year, when the probability of a positive return rises to 67%, that the investor’s perceived economic benefit finally turns positive (0.01). At 20 years, when the probability of a positive return is 100%, the utility increases to 1.0.
So we see that achieving positive utility in an equity investment—in other words, avoiding loss aversion—requires a holding period of at least one year.
Myopic Loss Aversion
Because the chance of experiencing negative returns is higher in the short term, the more frequently investors evaluate their portfolios, the more likely they are to see losses and develop loss aversion. By the same token, the less frequently they evaluate their portfolios, the more likely they are to see gains. And this is why we call the increased loss aversion that investors experience when they scrutinize their portfolio performance on daily or weekly basis “myopic loss aversion.”
Daniel Kahneman, a Nobel laureate and one of the founders of the field of behavioral economics, expressed it this way:
The attractiveness of the risky asset depends on the time horizon of the investor. An investor who is prepared to wait a long time before evaluating the outcome of the investment as a gain or a loss will find the risky asset more attractive than another investor who expects to evaluate the outcome soon. –Richard Thaler, Amos Tversky, Daniel Kahneman, and Alan Schwartz, “The Effect of Myopia and Loss Aversion on Risk Taking: An Experimental Test”
Modifying Investor Behavior
Although loss aversion is part of our psychological wiring as human beings, the frequency of evaluations is a choice that investors (and their investment advisers) can control. And since most investors are accumulating assets in preparation for a multi-decade retirement—or longer, in the case of a planned transgenerational transfer of wealth—it makes sense to adopt evaluation periods that correspond with these time horizons.
But very few people—whether they are investment professionals or otherwise—establish appropriate evaluation frequencies of a year or more. The typical result is an asset allocation mix in which equities (so-called “risky” assets) are underrepresented, despite nearly a century’s worth of compelling historical evidence demonstrating how much better these assets perform over longer time horizons when compared to other investment options.
Key Behavioral Takeaway
If you check your stock portfolio on your smartphone every day, it will be ruinous to your wealth. Instead, work with a trusted investment adviser to create a comprehensive financial plan, and stick to it through the market’s inevitable ups and downs. Then, open your account statements about once a year to review your portfolio and see how your investments are growing.