Equities Are Not Overvalued

“Today is the scariest day for investors in 17 years,” declared a Yahoo Finance headline on Aug. 11, 2016. And why was it so scary? Because for the first time in 17 years—since December 31, 1999—all three of the major U.S. stock indices closed at all-time highs. It happened again two trading days later, on August 15.
Although the article contained nothing passing for analysis, it concluded with a dire warning: “Be afraid. Be very afraid.”
So what is it, exactly, that investors should fear? Why, it’s the overvaluation of equities, of course, and the market correction that’s sure to follow.
The equity market Cassandras all use some variation of the same simplistic analysis to conclude that the stock market is overvalued. Relative to any single metric—whether it be trailing earnings, forward earnings or the Shiller P/E ratio—valuations today are higher than their historical averages.
While true, this is a one-factor analysis in a two-factor equation. There is a crucial variable missing: interest rates. Finance 101 taught us that equity prices are determined by the present value of future dividends. Valuations, therefore, are dependent on interest rates. Other things being equal, higher interest rates equal lower valuations, and lower rates equal higher valuations.
With this foundation, allow us to make the case that equities are not overvalued. It’s a simple one.
- On Sept. 9, 2016, the S&P 500 closed at 2,127.81.
- According to FactSet, the consensus 12-month forward earnings estimate for the S&P 500 is about $130 ($118.54 in calendar year 2016; $134.28 in calendar year 2017).
- Based on this earnings estimate, the forward 12-month P/E ratio for the S&P 500 is 16.4x, above both the 5-year average of 14.8x (source: FactSet) and the 25-year average of 15.9x (source: J.P. Morgan).
- Over the last 25 years, the average yield of the 10-year Treasury has been 4.55%, compared to 1.67% on Sept. 9 (source: J.P. Morgan).
- Based on these facts, we conclude that with the interest rates used for discounting dividends a little over one-third their 25-year average, the half-percentage-point premium between today’s forward earnings multiple and the 25-year average is fully justified, if not modest.
Looking at it from another perspective, the dividend yield of the S&P 500 is now about 2.1%, or almost 25% higher than the current 10-year Treasury yield. Over the last 60 years, the dividend yield of the S&P 500 has historically traded at about a 40% discount to the 10-year Treasury yield.
Do you remember the Fed model for equity valuation used in the Greenspan era? In its strongest form, the Fed model states that the bond and stock markets are in equilibrium and fairly valued when the one-year forward-looking earnings yield equals the yield of the 10-year Treasury.
With projected forward earnings of $130, and based on the Sept. 9 close of about 2,127, the earnings yield of the S&P 500 is just about 6%. An equilibrium earnings yield of 1.7% (to match the current 10-year yield) would imply an S&P 500 fair value of over 7,600 under the Fed model (7,647 x earnings yield of 1.7% = $130 of forward earnings).
At one point, the Fed model was all the rage for valuing equities. Then the Great Recession came. Eight years ago (Sept. 15, 2008), 158-year-old Lehman Brothers filed for bankruptcy (which was and still remains the largest U.S. bankruptcy ever). Since then, according to J.P. Morgan, central banks around the world have cut interest rates 670 times. Now the Fed model no longer works, and it’s yesterday’s news.
Today’s rage is the Shiller P/E, or CAPE, ratio, for which Yale University economics professor Robert Shiller won a Nobel Prize. This cyclically adjusted price-to-earnings ratio is a valuation measure defined as price divided by the average of 10 years of earnings (moving average), adjusted for inflation.
The current Shiller P/E of about 26x is dead in line with its 25-year average of 25.8x, but it’s about 57% higher than its long-term average of 16.7x, as measured since 1881 (source: Merrill Lynch). That’s why many of today’s market pundits, relying on an average going back to the Reconstruction era, say today’s stock market is extremely overvalued. But is this a valid conclusion?
In an intriguing Financial Analysts Journal article published earlier this year, Wharton professor Jeremy Siegel pointed out that between 1981 and 2015, the CAPE ratio signaled that equities were overvalued in no fewer than 416 of 422 months (or 98.6% of the time). So much for CAPE valuation as a reliable predictor of future equity prices.
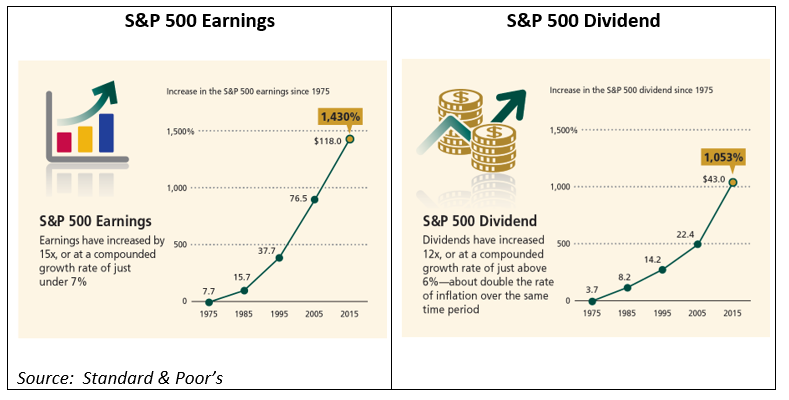
The earnings of the S&P 500 have risen steadily over time, compounding at about 7% over the last 40 years. Dividends have been compounding at about 6% over the same time period.
Thus, it should not be remarkable that growing earnings and dividends have manifested from time to time as new highs in companies’ stock prices—and the indices comprising those companies. Similarly, there is nothing to infer from a single stock market index reaching a new record high, in and of itself—or by three indices reaching record highs on the same day.
But when the financial media warn us that it’s the scariest day for investors in 17 years and that we should be very afraid, think instead of this wisdom from Macbeth: “It is a tale told by an idiot, full of sound and fury, signifying nothing.”
In a “normal” interest rate environment, for example in line with the 25-year average yield of 4.55% for the 10-year Treasury, equities would be discounted at a higher rate with correspondingly lower values. But there’s a large gap between today’s rates and the historical averages.
Our point in this essay is not to take cheap shots at the financial media or whatever equity valuation models may be in vogue on Wall Street. Instead, it is to provide a reminder that (i) securities are valued based on the discounted present value of future cash flows, (ii) dividends are the source of cash flows for equities, and (iii) when interest rates fall (especially to near zero), the valuations of equities must rise accordingly.
Behavorial Takeaway
Narrow framing involves making decisions without considering all the implications. In a financial context, it means evaluating too few factors regarding an investment. Regardless of the methodology used for valuing equities, there is always some measure or stream of cash flows—such as dividends or earnings—that must be discounted by some interest rate. In its simplest form, it’s a two-factor model. Valuing equities solely relative to a historical average crucially ignores the second variable of interest rates, which are currently at an unprecedented low. Such one-dimensional, narrowly framed thinking has caused many investors to shun equities and miss the historic bull market of the past five years.