Cracking the Private Equity Code

Once upon a time, private equity was called leveraged buyouts, and the practitioners were known as LBO artists. The art form was acquiring a company with a small equity investment and lots of debt, providing management expertise to improve the underlying business, and then using the company’s cash flows to pay down the debt and deleverage over time.
From their early series of “bootstrap” investments in the 1960s, Jerome Kohlberg, Jr., Henry Kravis and George Roberts formed KKR in 1976—the same year that Vanguard launched its first index mutual fund.
The private equity industry (including venture capital) has come a long way in 40 years, and it’s now a nearly $4 trillion category, consisting of $2.6 trillion in managed assets and $1.2 trillion in committed but undeployed capital (i.e., “dry powder”). A big chunk of that $4 trillion has come from university endowments attempting to leverage their infinitely long investment horizons to exploit less liquid and presumably less efficient markets.
So we thought it would be timely to explore the private equity industry more closely in an attempt to crack the code. Let’s begin with a deductive analysis of the return that an investor should rationally expect from a private equity investment of the leveraged buyout variety.
Using the building block approach developed by Ibbotson Associates, the expected return on an asset class represents the sum of the current risk-free rate (i.e., inflation + 30-day Treasury bills) and one or more historical risk premia as compensation for each element of risk.
A conceptual view of this building block framework for selected assets is depicted below.
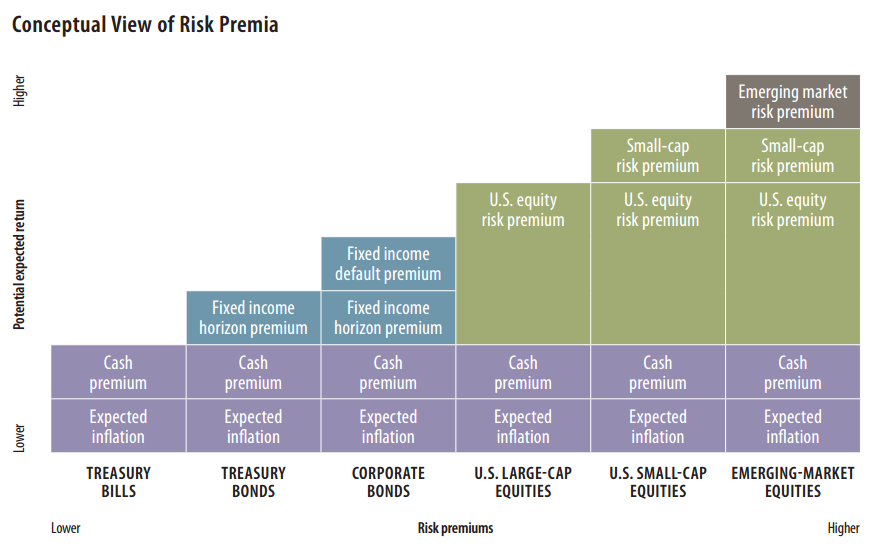
Source: Wells Fargo
Mathematically, we can express the nominal expected return for private equity as:
- Expected return = risk-free rate + equity risk premium + small-cap premium + illiquidity premium
Using Ibbotson data going back to 1926, the building blocks that contributed to the 12% historical annual returns (on a nominal basis) consisted of:
- Risk-free rate: 3.5% (3% inflation + 0.5% cash premium)
- Equity risk premium: 6.5%
- Small-cap premium: 2%
What about the illiquidity premium required for private equity? Here is the simplest way to think about it: How much extra annual return would you, as an investor, demand if you didn’t have access to your capital for five to 10 years? A typical answer is between 3% and 5%.
Based on a review by PitchBook of 1,291 global private equity investments in Q3 2016, the median deal size was $31.2 million, a decrease of 23% year-over-year from the $40.3 million median deal size in Q3 2015.
Most private equity investments are in companies that would be classified as small-cap stocks (typically defined as those having a market capitalization between $300 million and $2 billion). So, based on the long-term historical return data and associated risk premia from Ibbotson, an investor should reasonably expect a total annual return (net of all fees) of at least 15% (the historical small-cap return of 12% plus an illiquidity premium of 3%).
But there’s a major flaw in this analysis: Although we have added a 3% premium for illiquidity, we have completely ignored leverage, which is about 60% in a typical LBO transaction. So let’s try to isolate and understand the impact of leverage on private equity returns by visiting a study conducted by the Yale Investments Office.
Over the course of his 31-year tenure overseeing Yale’s endowment, David Swensen has dramatically shifted Yale’s portfolio from predominantly marketable securities (cash, bonds and stocks) to predominantly “alternative investments,” such as private equity, hedge funds and real estate.
The Yale Model, or “endowment model,” of investing has attracted many followers and imitators, but evidently many of those people have never bothered to read Swensen’s book, Pioneering Portfolio Management: An Unconventional Approach to Institutional Investment. If they had, here is one important lesson they would have learned:
In a comprehensive study of 542 completed buyout deals from 1987 to 1998 (a strong bull market period, to be sure), buyouts outperformed marketable securities in gross return by a landslide: 48% per annum for buyouts versus 17% for the S&P 500. In an effort to make an apples-to-apples comparison, Yale then made two adjustments to the return data.
First, Yale adjusted the buyout returns for management and performance fees, resulting in a net return of 36%—which was still more than double the returns of the S&P 500. Then, Yale made a second critical adjustment to the S&P return (i.e., a marketable security) to reflect an equivalent amount of leverage to that used in the buyout control group.
Here are the results in Swensen’s own words: “Comparably timed, comparably sized, and comparably leveraged investments in the S&P 500 produced an astonishing 86 percent annual return. The risk-adjusted marketable security result exceeded the buyout result of 36 percent per year by an astounding 50 percentage points per year.”[1]
Swensen’s conclusion about private equity is unambiguous: “In fact, only top-quartile or top-decile funds produced returns sufficient to compensate for private equity’s greater illiquidity and higher risk. In the absence of truly superior fund selection skills (or extraordinary luck), investors should stay far, far away from private equity investments.”[2]
Thanks in no small part to the remarkable success at Yale, private equity has increasingly become the alternative asset class of choice and the new shiny object of the investment world. Public pensions now have 10% of their money allocated to the category, and many endowments have much more.
Based on data from the last three decades compiled by Cambridge Associates and Preqin, private equity investors have enjoyed a 3% annual advantage over the S&P 500—in line with theoretical expectations for the illiquidity premium, but with zero corresponding return contribution from the addition of leverage.
New Information
As a young Harvard graduate working at Bain Capital, Dan Rasmussen was assigned the task of examining 2,500 LBO deals representing $350 billion of invested capital over 30 years to figure out what did and didn’t work in private equity. He reached two conclusions:
- Private equity is effectively a leveraged small-cap strategy. According to a recent Forbes article, “95% of leveraged buyouts involved companies with an enterprise value (debt plus equity) below $1.1 billion, or roughly the upper bound of the small-cap universe.”
- The purchase price, unsurprisingly, determines the outcome, with 7x cash flow (earnings before interest, taxes, depreciation and amortization) being the magic number for success. According to Rasmussen’s analysis, “The 25 percent of the cheapest deals accounted for 60 percent of the profits,” and “The most expensive 60 percent of deals accounted for 10 percent of profits.”
Rasmussen’s company, Verdad, is attempting to become the Vanguard of the LBO industry, charging a management fee of only 1.5% and no performance fee (in contrast to an industry standard of 2% and 20%). Research reported on Verdad’s website (http://www.verdadcap.com/) “suggests that investing in leveraged small value stocks in the public markets would have had an average annual return of 25.1% from 1965-2013 and significantly outperformed private equity.” Private equity returns over 10-year rolling periods have clustered between 10% and 15% annually over the past decade.
We haven’t done any diligence on either Rasmussen’s research or Verdad, nor are we recommending either the firm or any fund managed by Verdad. But it’s certainly interesting food for thought.
Comparing Public and Private Equity
“How Do Private Equity Investments Perform Compared to Public Equity?” asks the title of a recent paper by Steven N. Kaplan, Robert S. Harris and Tim Jenkinson. Kaplan, who teaches at the University of Chicago’s Booth School of Business, is considered to be the foremost private equity scholar in the country. He and his co-authors answer the question thusly: “Post-2005 vintage year returns have been roughly equal to those of public markets.” The following chart illustrates this point.
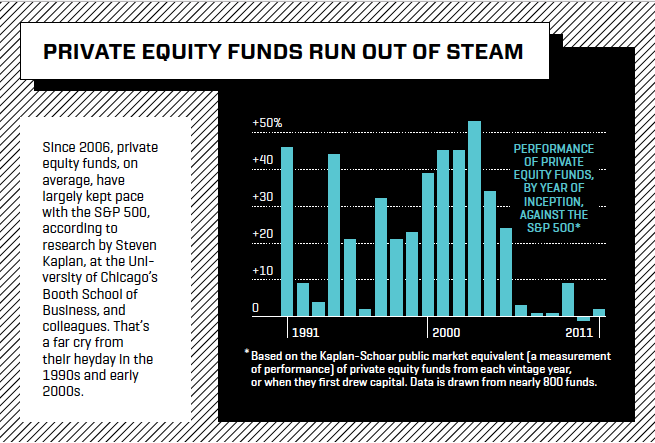
Source: Roger Lowenstein, “Private Equity’s Paper Tigers,” Fortune, December 15, 2015.
If an investor borrowed 50% of the value of an underlying investment in the S&P on margin (the limit under Regulation T), based on the index’s long-term total return of 10%, the levered return would be 15% before borrowing costs. But in this scenario, the investor has total transparency to a fully diversified portfolio and access to his capital at all times. So which is better: an investment in a private equity fund or a levered stock index investment? Pick your poison.
Ultimately, we come neither to praise nor bury private equity. Instead, our purpose is to demystify this asset class and provide investors with the analytical framework and intellectual tools to form rational return expectations about it.
Behavorial Takeaway
Social proof is a psychological phenomenon in which people mimic the actions of others in an attempt to adhere to the correct behavior in a given situation. It’s the idea that if everyone else is doing something—particularly thought leaders—it must be the right thing to do.
But, as mothers have said since the dawn of time, “If everyone else was jumping off a cliff, would you do it, too?” Before diving into alternative asset classes just because others are doing so, investors would do well to fully understand each investment’s (or manager’s) theoretical source of alpha, whether the potential extra return is likely to compensate the investor for all associated risks, and whether the excess return is sustainable.
[1] Swensen, David F. Pioneering Portfolio Management: An Unconventional Approach to Institutional Investment. New York: Free Press, 2009, p. 225.
[2] Ibid., p. 224.